Car Wash Labor Cost Benchmarks by Region: Wages, Staffing Models, and Revenue Share
Car Wash Labor Cost Benchmarks by Region: Wages, Staffing Models, and Revenue Share
Ask a room of car wash operators what keeps them up at night and the answer is rarely the equipment — it's the people. The International Carwash Association's CAR WASH Pulse for Q2 2026 puts labor shortages, turnover, and wage inflation at the center of the industry's operating challenges.
But "labor is expensive" isn't a number you can manage against. This is a set of car wash labor cost benchmarks you can — labor as a share of revenue, real attendant wages across regions, and the staffing headcount each format actually requires. Where you operate changes every one of them.
One more reason labor is the hardest line to control: it doesn't sit still. The industry's average manager tenure is around 3.5 years, and turnover and rehiring costs quietly inflate the true labor line well beyond the posted wage. A benchmark only helps if you measure the fully-loaded cost — base pay, benefits, and the churn underneath it — against the right reference point.
Car Wash Labor Cost as a Share of Revenue
Before comparing wages, anchor on the ratio that matters: labor as a percentage of revenue. It varies less by geography than by format.
Format | Labor as % of revenue |
|---|---|
Self-serve / in-bay automatic | ~5–10% |
Express tunnel (attended) | ~15–16% |
Flex-serve | ~25–35% |
Full-service | ~30–40% |
A modern express tunnel runs labor at roughly 15.8% of revenue, while self-serve and in-bay sites sit near 5–10%. Full-service is a different business: industry practitioners peg the line-labor benchmark around 35%, with total labor commonly 39% of sales. If your number sits well above the band for your format, that's the signal to investigate — before you assume it's just "the market."
The takeaway: benchmark by format first. A full-service operator and an express operator comparing raw labor percentages are comparing two different industries.
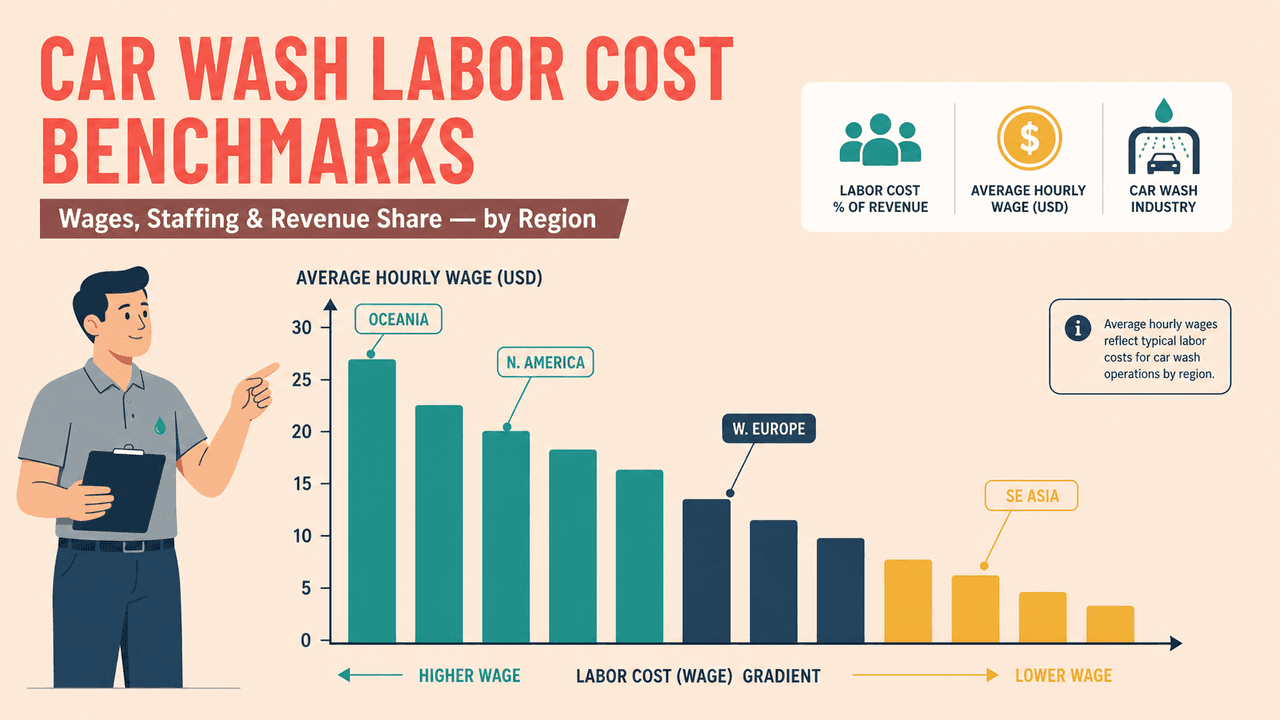
Car Wash Wages by Region
Within a format, the wage you pay is set by your local labor market, and across regions the spread is wide. Public data rarely isolates car wash pay by country — the one reliable car-wash-specific figure is the US average of about $14.51/hour. Elsewhere, the local minimum or service wage is the best available proxy, since attendant pay tends to sit close to that floor. The figures below are approximate USD equivalents from national minimum-wage data and Eurostat, offered as ballpark comparisons rather than quotes for any one market.
Region | Ballpark attendant wage (USD/hr) |
|---|---|
Oceania (Australia, New Zealand) | ~$14–18 |
North America (US, Canada) | ~$7–18 |
Western Europe (Germany, UK, France) | ~$12–17 |
Eastern Europe (Poland, Romania, Bulgaria) | ~$3–7 |
Latin America (Mexico, Brazil) | ~$1.50–3.50 |
Middle East / GCC | ~$1.50–2.50 |
Southeast Asia (Thailand, Vietnam, Malaysia) | ~$0.60–1.50 |
South Asia (India) | ~$0.30–1.20 |
Sub-Saharan Africa | ~$0.30–1.60 |
A few details the ranges don't capture:
The US alone spans most of the table. The federal minimum is still $7.25 while California sits at $16.00 and Washington, D.C. at $17.00, so two identical tunnels can face very different labor math inside one country.
Western Europe and Oceania set the high mark. Germany's statutory minimum is €13.90/hour (up 8.4% in a year) and Australia's runs around A$26/hour — the markets where hand-wash economics break down first.
The Gulf is a special case. Most car wash labor in the GCC is performed by migrant workers, who generally fall outside the statutory minimums that cover nationals (roughly $1.50–$2.20/hour). Effective pay often runs lower, and public figures are scarce — operators there should benchmark against local facilities and hospitality wages.
South and Southeast Asia sit at the floor, where sub-$1.50/hour wages still support labor-intensive hand-wash models that would be uneconomic in California or Germany.
Two caveats: conversions are approximate and move with exchange rates, and metro areas everywhere run above their national floor. What matters is the gradient — the same equipment removes far more cost in a high-wage market than a low-wage one.
Staffing Models: Headcount by Format
Wages set the price per worker; the format sets how many workers you need. Published staffing norms line up like this:
Format | Typical headcount |
|---|---|
Self-serve / in-bay | 1–2 attendants |
Express tunnel | 3–6 per shift |
Exterior conveyor | ~8 |
Flex-serve | ~15 |
Full-service | 20+ |
Those ranges come from operator staffing breakdowns by model, and they explain why the revenue-share band tracks format so tightly. The same source notes the lever every operator eventually reaches for: a highly automated site can run on 1–2 people where a comparable manual operation needs 6–8. Headcount, not hourly rate, is where the largest savings live.
Two cautions on those figures. First, they're minimums: turnover, absenteeism, and peak-hour coverage push real rosters above the nominal headcount, which is why a "three-person" express site often carries five or six names on the payroll. Second, the format isn't fixed — many operators back into flex-serve because they staffed a full-service menu they couldn't profitably crew. Choosing the format is, in large part, choosing the labor model.
How the Regional Wage Map Changes the Automation Decision
Put the two maps together — wages by region, headcount by format — and a pattern falls out. The value of removing a position is exactly the local fully-loaded wage. Automating away two roles is worth far more in a €13.90/hour market than a $200/month one, on identical equipment.
Work it through. If automation takes a site from six positions to two, that's four roles removed. At a US minimum-wage state floor of $16/hour, four full-time roles is roughly $130,000 a year in wages alone before benefits — recovered against a fixed equipment cost.
At Vietnam's ~$200/month, the same four roles is closer to $10,000 a year, and the identical machine takes far longer to pay for itself. The equipment doesn't change; the wage map decides the math. (Run your own numbers with your real fully-loaded rates — these are illustrative, not a quote.)
That's also why the conversation is accelerating: Germany's minimum wage rose 8.4% in a single year, EU labour costs 4.1%, and US states keep ratcheting their floors upward. Even where the headline wage holds, the fully-loaded cost climbs — US benefit costs alone rose 3.6% in the year to early 2026. Wage inflation doesn't just raise this year's labor line — it shortens the payback period on equipment that reduces headcount, every year it continues. A payback that looks marginal at today's wage often looks obvious two annual increases later.
A manufacturer's view, for what it's worth: this is the calculus our equipment is built to win — and the higher your local wage, the faster it pays back. The regional benchmark tells you whether automation is urgent; the equipment-and-headcount specifics — which features actually remove positions, and how the capex pencils out — are a separate analysis we worked through in how equipment choice cuts car wash staffing costs. Read alongside your cost-per-wash math and profit-margin targets, labor benchmarks stop being a worry and become a decision.
Key Takeaways
Benchmark by format first, region second. Express ~15–16% of revenue, full-service 30–40%, self-serve 5–10% — judge your labor line against your format's band.
Wages vary enormously by market. US ~$14.51/hr (but $7.25–$17 by state minimum), Germany €13.90, UK £12.71, Southeast Asia a fraction of those.
Headcount is the bigger lever than hourly rate. Automation can take a site from 6–8 people to 1–2.
Automation ROI scales with local wage. The higher and faster-rising your wages, the shorter the payback — which is why high-wage regions automate first.
Frequently Asked Questions
What percentage of car wash revenue is labor?
It depends on format. Express tunnels run roughly 15–16% of revenue, self-serve/in-bay sites 5–10%, and full-service operations 30–40% (with line-labor benchmarks around 35%). Benchmark your labor line against your format's band, not a single industry average.
How much do car wash workers make by region?
US attendants average about $14.51/hour, though state minimums range from $7.25 to $17. Germany's statutory minimum is €13.90/hour and the UK's is £12.71, while Southeast Asian minimums are far lower (e.g., Thailand THB 353–400/day). Local minimum wage is the strongest predictor of your labor cost.
When does automation pay off versus hiring more staff?
The payback on labor-reducing equipment is proportional to the local fully-loaded wage: the same machine pays back far faster in a high-wage market (California, Germany) than a low-wage one. Rising minimum wages shorten that payback every year, which is why automation adoption concentrates in high-wage regions.
Run the Numbers for Your Market
Labor benchmarks are only useful if they lead to a decision. If you want to model automation payback at your region's actual wage level, talk to HyTian's team — we'll work the labor math for your specific format and market.