The Operator's Guide to Car Wash Profitability: Margins, Benchmarks, and Optimization
The Operator's Guide to Car Wash Profitability: Margins, Benchmarks, and Optimization
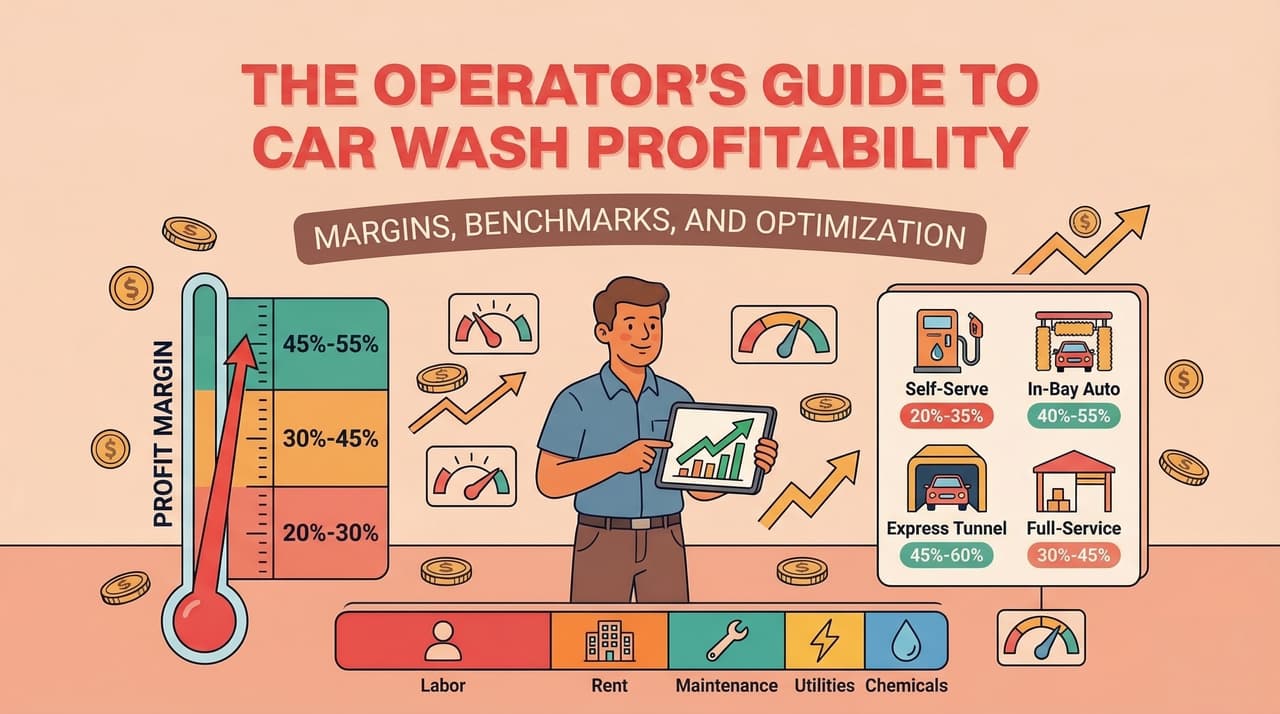
Before you invest in a car wash — or sink more capital into upgrading one — you need to know what realistic car wash profit margins actually look like. Not the optimistic projections from a business broker. Not the inflated numbers from a franchise pitch deck. The real ranges, based on how operators actually run their sites. In a US industry that exceeds $15 billion annually across roughly 60,000 locations, the spread between a mediocre operation and a highly profitable one is wider than most people expect. Car wash profit margins typically range from 20% to 55%, but where you land in that range depends on specific, controllable decisions — not luck. This guide breaks down margins by business model, maps where your operating costs actually go, and identifies the levers that separate average operations from high-margin ones.
What a realistic car wash profit margin looks like
The short answer: car wash business profitability varies dramatically by business model. Here is what the ranges actually look like.
Business Model | Typical Annual Revenue | Typical Net Margin | Key Margin Driver |
|---|---|---|---|
Self-serve bays | $50,000–$100,000 per bay | 35–55% | Near-zero labor, lowest revenue ceiling |
In-bay automatic (rollover) | $100,000–$250,000 per bay | 30–50% | Moderate labor, moderate throughput |
Express exterior tunnel | $500,000–$2,000,000+ per site | 25–40% | Higher revenue ceiling, higher fixed costs |
Full-service | $300,000–$1,000,000+ per site | 10–25% | Highest ticket average, highest labor burden |
The self serve car wash profit margin sits at the top of the range because labor — the single largest variable cost — is essentially eliminated. But the revenue ceiling is low. Express car wash profit margin ranges are narrower (25–40%), yet the absolute dollar profit on a well-run tunnel site often exceeds what a self-serve operation generates, because throughput and ticket averages are significantly higher.
Why is the range so wide? It maps directly to operational choices: the system type you select, how you manage chemicals and water, your pricing structure, and whether you run preventive or reactive maintenance. Two operators running the same business model in the same market can land 15 percentage points apart based on these decisions alone.
Is owning a car wash profitable? Yes — and it compares favorably to many retail businesses. Restaurant margins typically run 3–9%. Retail averages 2–5%. A well-run car wash operation, even at the lower end of the margin range, outperforms most retail categories on a percentage basis. The question is not whether car washes are profitable, but how profitable yours can be.
What is a good profit margin for a car wash? That depends on your business model. For attended operations (express tunnel, full-service), 35%+ net margin is strong. For unattended operations (self-serve, in-bay automatic), 40%+ is achievable with disciplined cost management. If you are below these thresholds, the levers in this guide can help you identify where the margin is leaking.
Car wash operating costs breakdown: where the money goes
Understanding your cost structure is the first step to improving it. Here is where your revenue typically goes, broken down by category as a percentage of gross revenue.
What are the biggest expenses in running a car wash? In order of impact:
Labor: 25–35% of revenue for attended operations, near-zero for unattended models. This is the single largest variable cost and the primary reason unattended models achieve higher margins. Your system type selection locks in your labor model for years.
Rent or mortgage: 10–20% of revenue. Fixed and location-dependent. You control this at site selection — not after. A high-traffic corner with premium rent can still deliver better margins than a low-rent site with weak traffic, because the volume economics outweigh the cost difference.
Equipment maintenance and repairs: 5–10% of revenue. This line item is where the gap between preventive and reactive operators shows up most clearly. Reactive maintenance means emergency calls, premium parts pricing, and peak-hour downtime. Preventive maintenance means scheduled service windows and predictable costs.
Utilities (electricity, gas): 4–8% of revenue. VFD-controlled motors on conveyors and dryers reduce energy draw compared to fixed-speed systems. The savings may seem modest per wash, but they compound across thousands of cycles per month.
Water and sewer: 3–8% of revenue. Water recycling systems reduce consumption by 50–80%, cutting both your water bill and sewer discharge fees. In jurisdictions with tiered water pricing, the savings accelerate as your volume grows.
Chemicals and detergents: 3–6% of revenue. This looks like a small line item, but imprecise dosing wastes 20–40% of chemical spend over a system's lifetime. Precision metering technology — such as CNC-controlled pumps achieving 0.28 mL accuracy per application — extends drum life significantly. A 20 kg chemical drum lasting 3,000 washes instead of 2,000 is a direct margin improvement on every vehicle.
Insurance, licensing, and miscellaneous: 3–5%.
The connection between your initial equipment investment and these ongoing operating costs is direct. Systems engineered for chemical precision, energy efficiency, and water recycling do not just reduce your environmental footprint — they reduce your cost-per-wash for years. For a detailed look at what equipment costs upfront, see our car wash system cost breakdown.
How much do car washes make? Revenue benchmarks by model
How much does a car wash owner make a year? The honest answer: it depends on your model, your volume, and your operational efficiency. But here are realistic benchmarks to frame your planning.
Revenue by business model:
Self-serve: $50,000–$100,000 per bay annually at average ticket prices of $5–$8 per wash.
In-bay automatic: $100,000–$250,000 per bay annually at $10–$15 per wash.
Express exterior tunnel: $500,000–$2,000,000+ per site annually. Revenue scales directly with throughput capacity and ticket average ($10–$15 per wash). A system processing 50–60 vehicles per hour at a $12 average ticket has a fundamentally different revenue ceiling than one processing 20 per hour.
Full-service: $300,000–$1,000,000+ per site at $15–$25 per wash. Higher ticket averages are partially offset by the labor cost required to deliver the service.
Throughput is the revenue ceiling. Your equipment's processing capacity sets the maximum number of vehicles you can wash per hour. Your operations — queue management, staffing, menu design — determine how close you get to that ceiling. During the 20 highest-volume hours each week, even small throughput gains have outsized revenue impact. High-throughput tunnel systems processing 50–60 vehicles per hour create revenue potential that lower-capacity systems simply cannot match, regardless of pricing strategy. In high-demand markets, sites running optimized tunnel operations have achieved 500+ washes per day during peak periods.
Membership models stabilize revenue. Car wash membership programs have grown 30%+ industry-wide since 2020, and for good reason. Members spend 2–3x more annually than pay-per-wash visitors, and the predictable monthly revenue reduces your exposure to weather and seasonal volatility. Car wash membership program revenue now accounts for 40–60% of total revenue at top-performing express tunnel sites. If you are not running a membership program, that is likely your single highest-impact revenue opportunity. For strategies on building membership into your operation, see our car wash membership playbook.
The equipment decisions that shape your margins
This is where the manufacturer's perspective offers insight that business brokers and financial advisors cannot provide. Equipment decisions are margin decisions — they set your throughput ceiling, your labor model, and your cost-per-wash baseline for years. Understanding how to increase car wash profitability starts here.
System type selection determines whether you operate with zero, two, or eight employees per shift. That labor model is the single biggest margin differentiator between business models. The system you choose locks in your cost structure — and your margin range — for the life of that equipment.
Chemical dosing precision is a margin lever most operators underestimate. Imprecise dosing wastes 20–40% of chemical spend over a system's lifetime. Precision metering — CNC-controlled pumps achieving 0.28 mL accuracy per application — extends a 20 kg chemical drum from roughly 2,000 washes to approximately 3,000 washes. Multiply that saving across every drum, every month, for years. It compounds.
Energy efficiency at scale matters more than most operators realize. VFD-controlled motors on conveyors and dryers adjust energy draw to actual load rather than running at fixed speed regardless of demand. Across thousands of wash cycles per month, the savings are meaningful.
Water recycling reduces both consumption and sewer fees. Systems with integrated water recycling cut water-related costs by 50% or more. In markets with rising water costs or tiered sewer rates, this capability becomes increasingly valuable over time.
Brush and material quality affects more than wash results. Lower-cost brush materials mean higher replacement frequency and increased risk of vehicle damage claims. EVA closed-cell foam brushes resist grit carryover and protect modern clearcoats, reducing both liability exposure and long-term replacement costs.
Maintenance accessibility is the hidden cost multiplier. Systems designed for easy part replacement reduce technician time and minimize downtime duration. The difference between a 30-minute fix and a 4-hour repair during a Saturday peak is hundreds of dollars in lost revenue — plus the labor cost difference.
When you are evaluating equipment, you are really evaluating your future margin structure. Explore car wash business solutions that match system configuration to your volume targets.
Five levers to improve car wash profitability
Profitability is not fixed — it responds to specific, controllable decisions. Whether you are planning a new site or optimizing an existing one, these five levers apply regardless of your current business model.
Lever | Typical Impact | Difficulty | Time to Impact |
|---|---|---|---|
Wash menu and pricing optimization | +15–30% ticket average | Low | Immediate |
Membership program implementation | +40–60% revenue stability | Medium | 1–3 months |
Equipment efficiency (chemical, water, energy) | -10–25% cost-per-wash | Medium | 1–3 months |
Peak-hour throughput maximization | +10–20% weekly revenue | Medium | 1–3 months |
Preventive maintenance program | -15–25% maintenance spend | Low–Medium | 3–6 months |
Lever 1: Optimize your wash menu and pricing tiers. A well-designed good-better-best pricing structure drives ticket averages up 15–30% compared to flat pricing. Most operators leave money on the table by offering too few tiers or failing to anchor the premium option effectively. This is the fastest lever to pull.
Lever 2: Implement or expand membership programs. Predictable monthly revenue, higher lifetime value per client, and reduced weather and seasonal volatility. Members spend 2–3x more annually than pay-per-wash visitors. Top-performing express tunnel sites generate 40–60% of their revenue from recurring memberships. Read our car wash membership playbook for implementation strategies.
Lever 3: Reduce cost-per-wash through equipment efficiency. Chemical precision, water recycling, and energy management compound into meaningful per-wash savings across thousands of cycles. The metric to track is cost-per-wash, not just revenue-per-wash — because that is where equipment quality translates directly into margin.
Lever 4: Maximize throughput during peak hours. Queue management, express wash options, and system speed optimization. Your peak-hour capacity determines your revenue ceiling. Even small throughput gains during the 20 highest-volume hours per week have outsized impact on weekly revenue.
Lever 5: Shift from reactive to preventive maintenance. Unplanned downtime during peak hours is the most expensive operational event a wash site can experience. A tunnel system offline for 2 hours on a Saturday can cost $500–$1,500+ in lost revenue alone — before you add the emergency repair premium. Operators who transition to preventive maintenance programs report 15–25% reduction in total maintenance spend within the first year. For a practical starting point, see our cold-weather maintenance guide.
Key takeaways
Car wash profit margins range from 20% to 55% — where you land depends on your business model, equipment choices, and operational discipline, not luck.
Labor is the largest variable cost (25–35% of revenue in attended models) and the primary reason unattended operations achieve higher margins.
Equipment decisions lock in your cost structure for years — chemical dosing precision, energy efficiency, water recycling, and maintenance accessibility all directly affect your margin.
Membership programs stabilize revenue and increase per-client lifetime value — top express tunnel sites generate 40–60% of revenue from recurring memberships.
Profitability improves through controllable levers: pricing architecture, membership, equipment efficiency, peak-hour throughput, and preventive maintenance.
Start with the right equipment decisions
Your site's profitability starts with the equipment decisions you make today. Every system choice — from tunnel type to chemical dosing to water management — shapes your cost-per-wash, your throughput ceiling, and your margin potential for years to come.
Our engineering team helps operators match system configuration to their specific volume targets and margin goals. No generic recommendations — just the analysis you need to make a confident decision.
Discuss your site's profitability potential with our engineering team.
Related articles
Explore more insights from the HyTian team.

How Much Does an Automatic Car Wash System Cost? A Complete Investment Breakdown
Automatic car wash system costs range from $15,000 to $350,000+ for equipment alone. Here's what drives the price, what the total investment looks like, and how to compare quotes.

How to Evaluate a Car Wash Equipment Manufacturer: A Buyer's Checklist
A practical buyer's checklist for distributors and dealers evaluating a car wash equipment manufacturer. Learn what to look for in engineering capability, certifications, after-sales support, and global track record before committing to a factory partnership.
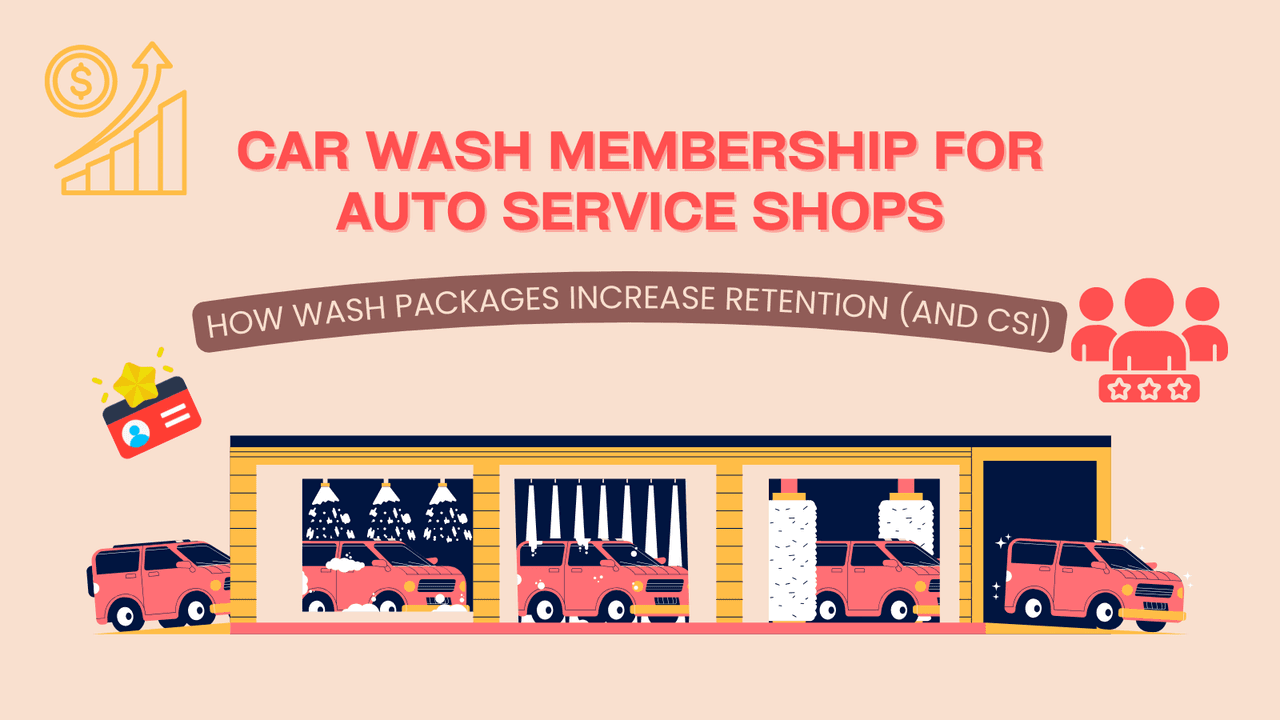
Car Wash Membership for Auto Service Shops: How Wash Packages Increase Retention and CSI
Learn how service shops use wash packages and memberships to boost repeat visits, improve delivery experience, and build predictable revenue—with the right equipment setup.