
Cost-Per-Wash Calculation: How to Measure and Optimize Your True Operating Cost
Cost-Per-Wash Calculation: How to Measure and Optimize Your True Operating Cost
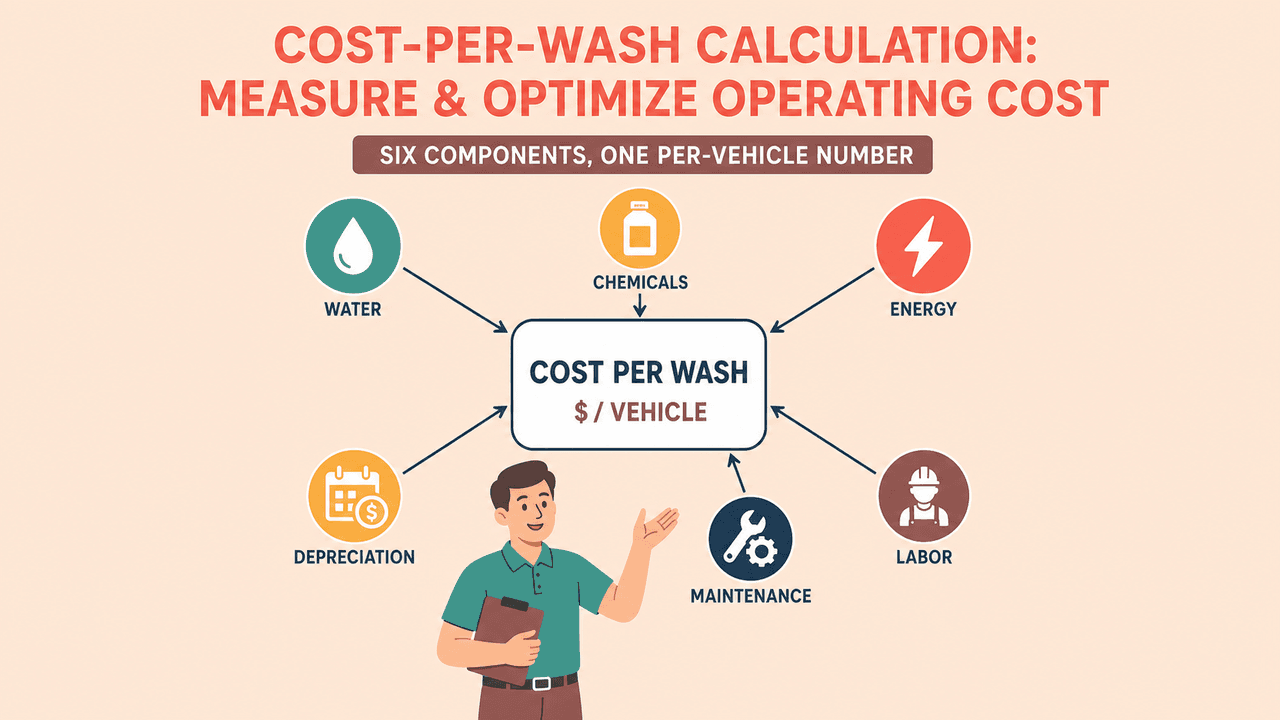
When the chemical drum runs out three weeks earlier than the wash count justifies, or the water bill jumps without the volume jumping with it, you're looking at a cost-per-wash leak that a monthly P&L summary won't show you. Every operator running an automatic system is exposed to the same six lines — water, chemicals, energy, labor, maintenance, and depreciation — and the equipment underneath those lines quietly shifts each one. This guide walks through a complete cost per wash calculation method, names the equipment behaviors that move the math, and gives you a controllable-first optimization order to work this quarter.
Why Cost-Per-Wash Is the Right Unit
Operators tend to track margin and revenue per month. That works for understanding overall profitability — and you can read the car wash profit margin benchmarks for the layer above this one. But monthly totals hide where the leaks live. A site running 8,000 vehicles a month can spend the same on chemicals as a 12,000-vehicle site if dosing is sloppy. The first site doesn't see the problem because the line "looks normal" in absolute dollars. The second site doesn't see it either, because higher volume masks higher waste.
Cost-per-wash strips that ambiguity. You compute it once for every component of your car wash operating costs, and suddenly each drum, each kWh, each labor hour has a per-vehicle number you can compare across months, packages, and equipment design choices. ROI calculations and payback periods both depend on this unit-economics layer being right.
The Six Components of Cost-Per-Wash Calculation
A complete cost per wash calculation has six lines:
Water — fresh draw plus sewer plus any reclamation system overhead
Chemicals — soap, presoak, wax, drying agent, tire dressing, wheel cleaner
Energy — pumps, motors, dryers, conveyors, controls, lighting
Labor — on-duty attendant hours allocated to washes produced
Maintenance — scheduled consumables, brush replacement, fluids, plus unscheduled repair and downtime
Depreciation and financing — equipment capex amortized across lifetime washes, plus interest if financed
None dominates uniformly. Their relative weight shifts dramatically with equipment type — tunnel, in-bay rollover, or touchless — and with the specific design choices inside each category (dosing precision, recycling integration, dryer power, brush longevity). The rest of this guide walks each line in order.
Water Costs Per Vehicle
Water cost per wash is the simplest math, the most regionally variable input, and the line that responds most dramatically to equipment design.
Water cost per wash = (gallons per cycle × ($ per gallon + sewer rate)) − reclamation offset
Two variables move this line: gallons per cycle and reclamation. Touchless systems use significantly more water than brush systems — the cleaning mechanism is high-pressure displacement instead of mechanical brush contact, so volume and pressure do the work that bristles otherwise would. Our MY-385 touchless system operates at 120 L/min at 1000 psi across two 15 kW pumps; multiply flow rate by your actual cycle minutes to get gallons-per-cycle for your wash menu.
Reclamation changes the math even more than design type does. Closed-loop water recycling reclaims rinse water, treats it, and recirculates it to pre-rinse and brush-wash stages — net fresh draw drops, and sewer discharge drops with it. Our TX-380 tunnel system supports integrated water recycling, and the same approach runs at scale for Zhuhai Public Transport, where TH-Series drive-through bus washers integrate recycling at depot peak operations of up to 80 buses per hour.
A practical answer to the car wash water usage per vehicle question: don't trust a published flow rate alone. Install per-cycle flow meters, capture three weeks of real usage across your wash menu mix, and weight the average. That's the number that goes into your car wash water and chemical costs calculation.
Chemical Costs Per Vehicle
Chemical cost is where the gap between equipment design choices is largest, and where most operators discover they were overspending by 30-60% the day they instrument the line.
Chemical cost per wash = sum across products of (mL dosed per cycle × $ per mL)
That formula is unforgiving because both variables compound. Dosing off by 20% on volume doesn't just add 20% to chemical cost — it accelerates drum replacement and shortens the windows where supplier discount tiers apply. Most volumetric dosing systems run wider than operators believe. The fix is metering precision.
For the car wash chemical cost per vehicle line, the TX-380 runs CNC metering pumps with 0.28 mL precision per dose, which extends drum life to approximately 3,000 washes per 20 kg drum. To translate that into your cost line, take your invoiced price per 20 kg drum, divide by 3,000, and you have a per-wash chemical cost for that product on a TX-380. Repeat for each chemical in your wash menu (soap, presoak, wax, drying agent, tire dressing) and you have a complete chemical line.
Compare that to a sloppy-dosing baseline. If imprecise volumetric metering pushes you to 1,800 washes per drum on the same chemical, your per-wash cost is 67% higher with no quality improvement to show for it — the wax came on at the right time, the soap covered the body, and the difference went down the drain. This is typically the largest controllable line in a car wash water and chemical costs profile.
Wash menu mix matters here too. If 70% of vehicles get a basic package, your chemical cost profile is dominated by basic-wash dosing. Weight line items by package mix before you set targets.
Energy Costs Per Vehicle
Energy cost is a function of installed power, on-time duty cycle, and your electricity rate.
Energy cost per wash = ((motor kW × motor min + dryer kW × dryer min + aux kW × aux min) / 60) × $ per kWh
Installed power varies widely by equipment type. The XL-200 rollover runs on 380V at 17 kW total — a compact in-bay system right-sized for sites doing 15-20 vehicles per hour. The XL-200NET self-service variant adds a 4×5.5 kW dryer array on top. Touchless steps up: the MY-385 carries 35 kW of total installed load, dominated by two 15 kW high-pressure pumps. Tunnel systems vary by configuration — the TX-380 is modular, with VFD (variable frequency drive) speed control on the conveyor that runs motors at the speed the current vehicle actually needs rather than at constant peak draw.
The largest single energy loads in any configuration are usually dryers and high-pressure pumps. Both run at high duty cycles relative to brush motors or conveyor drives, and both are sensitive to cycle-time decisions in the wash recipe. Shaving 15 seconds of dryer-on time across 20,000 washes a year on a 22 kW dryer array drops 4,400 kWh out of your bill, with no other operational change.
Track duty cycle in seconds per package, multiply by installed kW, multiply by your local electricity rate, and you have a defensible energy cost per wash that ties directly to equipment choices. The same number ties forward into sustainable car wash operations for operators tracking environmental KPIs alongside cost.
Labor Costs Per Vehicle
Labor is the line where equipment type shifts the cost profile most dramatically. The formula is the simplest in the set:
Labor cost per wash = (hourly wage × on-duty hours) ÷ vehicles washed in that period
Express tunnel operations push this line low — one or two attendants can support throughput in the 50-60 vehicles per hour range, which puts labor per wash on a different curve than self-serve or full-service models. In-bay rollover sites can run unattended for stretches with cashless scan-to-start configurations, collapsing the on-duty hours variable.
The car wash labor cost deep dive walks staff-per-throughput by equipment type. For the cost-per-wash calculation, what matters is plugging in your actual on-duty hours, not your nominal posted hours. Many operators discover labor per wash is 20-40% higher than budgeted because schedule overlap and slow-hour staffing aren't accounted for cleanly.
Maintenance Costs Per Vehicle
Maintenance has two distinct components that need to be tracked separately:
Maintenance cost per wash = (scheduled maintenance + unscheduled repair + downtime revenue loss) ÷ annual washes
Scheduled maintenance covers consumables, brush replacement, fluid changes, and the preventive maintenance checklist program. Unscheduled repair is the line operators routinely underestimate. The full cost of an unscheduled stop isn't just the part and the technician — it's the revenue you didn't collect during the downtime window, which on a high-volume peak hour can outweigh the repair invoice several times.
Brush life is the largest swing factor on the consumables side. EVA closed-cell foam brushes — wide-profile, linear pressure curve, engineered to resist grit carryover and protect modern clearcoats — are the brush technology HyTian deploys on the TX-380. They were also the brush BYD selected for new-vehicle wash standardization on factory-fresh paint across BYD factories, where any blemish on a factory-new finish is unacceptable. The same paint-safety logic that justifies them on an OEM factory floor justifies the consumables math on a retail tunnel: longer service life, fewer replacement events per thousand washes, and no clearcoat damage events to remediate.
Run the cost-effective brush versus premium brush trade-off on your own numbers. A consumable that lasts twice as long at 1.5x the unit cost wins the cost-per-wash line meaningfully — and that's before you account for the labor of swap-outs and the downtime hour each swap costs.
Depreciation and Financing Per Vehicle
The depreciation line is where your throughput strategy and your capex decision collide.
Depreciation per wash = (equipment cost − expected salvage) ÷ total expected lifetime washes
Throughput is the multiplier that makes or breaks this line. A higher-throughput system spreads fixed capex across more washes over the same service life. The TX-380 at 50-60 vehicles per hour, deployed at Splash N Go's tunnel sites in Japan, has demonstrated 500+ washes per day during peak periods — volume that divides any given capex over a much larger lifetime denominator than a lower-throughput configuration would on the same investment. Throughput strategy and depreciation strategy are the same conversation.
For capex inputs, use our cost of car wash equipment breakdown to ground the numerator. For the full payback-period analysis that depreciation per wash feeds into, the car wash ROI piece walks the math. If you finance, add interest to the numerator on an amortized basis using your actual terms.
How to Optimize Cost-Per-Wash on an Existing Site
Once you have all six lines, optimization runs in a controllable-first order. Five plays for this quarter, ordered by implementation cost:
Audit chemical dosing precision. Cycle three to five wash packages through the system, capture mL delivered per cycle on each chemical, and compare against the wash recipe specs. If you're running wide on dosing, the chemical line in your cost per wash calculation is overstated. Often 20-40% off that line with no quality compromise.
Install per-cycle water flow meters. Most operators lack per-cycle flow data, so they can't separate equipment behavior from billing-period variance. A few hundred dollars of metering hardware and three weeks of capture gives you a real gallons-per-wash number — and validates whether reclamation is delivering the offset you assumed.
Measure cycle time and dryer-on time in seconds, by package. These two numbers drive both energy and throughput simultaneously. Shaving idle dryer time or compressing recipe transitions moves the energy line and the throughput line in the same direction.
Run the brush-life vs. brush-cost trade. A premium brush at higher unit cost delivering 2-3x service life beats a cost-effective consumable on the per-wash maintenance line — usually by a wide margin once you include the labor and downtime of more frequent swaps.
Revisit your wash-menu mix. If your basic package is 70% of volume, optimize basic-package dosing and cycle time first. Full-detail optimization on a 5% tail moves the line less than a 1% improvement on the basic package.
The first two plays cost almost nothing and instrument lines most sites are flying blind on. Plays three through five build on that instrumentation.
Key Takeaways
Cost-per-wash is the unit-economics layer beneath profit margin and ROI. Calculate it first, then everything else makes sense.
Six components: water, chemicals, energy, labor, maintenance, and depreciation/financing. Track each separately — never lump them.
Equipment design moves every line: dosing precision shifts chemicals, water recycling shifts water, VFD speed control shifts energy, brush life shifts maintenance, throughput shifts depreciation.
Optimize the controllable lines first (chemical dosing audit, water flow tracking, cycle time measurement) before touching capex. Most operators have 20-40% available on chemicals alone before they need to revisit the equipment.
Want to See How the Math Shifts for Your Site?
Cost-per-wash calculation gets concrete the moment you plug your real numbers into it — your throughput targets, wash menu mix, local utility tariffs, current equipment configuration. We've helped clients across 40+ countries work through this analysis on tunnel, rollover, and touchless installations, drawing on over three decades of manufacturing experience since 1992. Talk to our engineering team about your specific site and we'll walk you through where each line moves — and which plays are likely to deliver the largest swing for your operation.
Start a conversation: Request a quote or talk to an engineer about your site's cost-per-wash math.
Related articles
Explore more insights from the HyTian team.
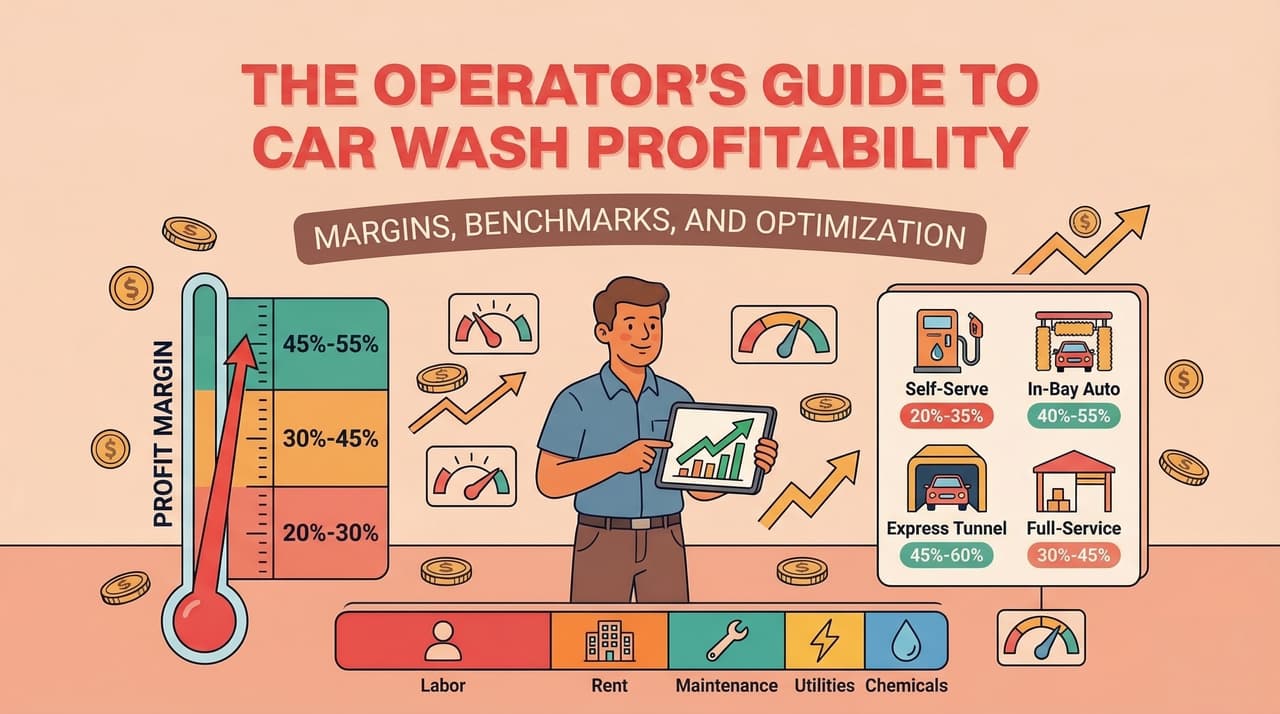
The Operator's Guide to Car Wash Profitability: Margins, Benchmarks, and Optimization
Car wash profit margins by format: 35–55% self-serve, 30–50% in-bay automatic, 25–40% express tunnel, 30–45% full-service with detailing, and what moves each.
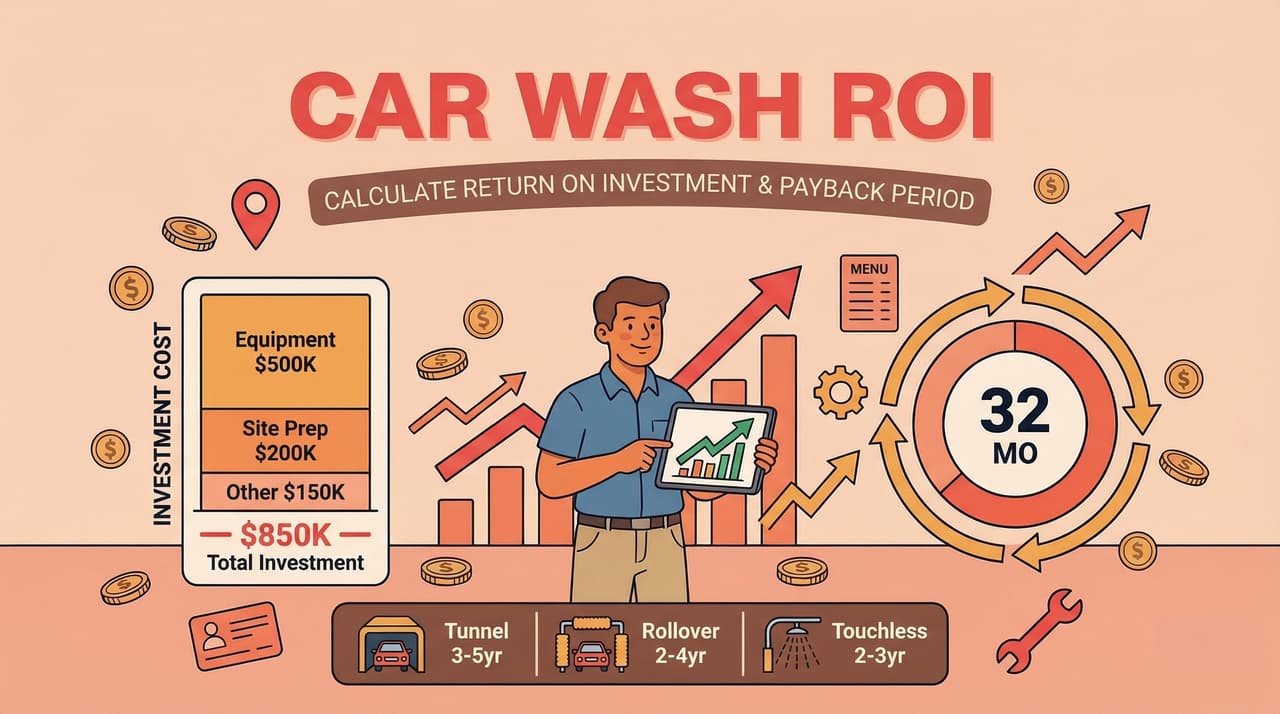
Car Wash ROI: How to Calculate Your Return on Investment and Payback Period
Car wash ROI typically ranges 20–35% annually with 2–5 year payback. Learn how to calculate your return, compare system types, and accelerate break-even.
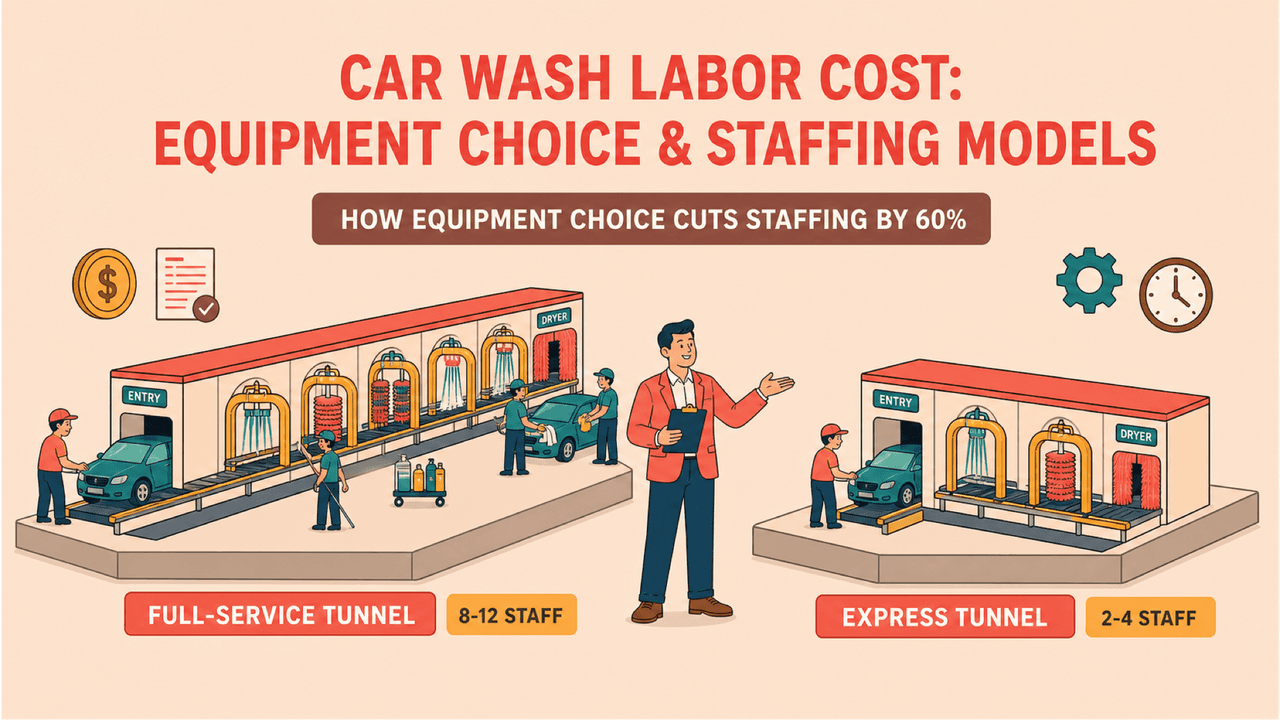
Car Wash Labor Cost: How Equipment Choice Cuts Staffing by 60%
Car wash labor cost is determined by equipment choice more than hiring tactics. See the staff-per-throughput math for express tunnel, IBA, and self-service models.