Car Wash ROI: How to Calculate Your Return on Investment and Payback Period
Car Wash ROI: How to Calculate Your Return on Investment and Payback Period
You've researched equipment options. You've compared system types and estimated build-out costs. But one question still sits at the center of your investment decision: when do I get my money back?
That's the question car wash ROI answers — not how much you keep per wash, but how quickly your capital investment pays for itself. For well-run automatic car wash operations, annual ROI typically falls between 20% and 35%, with payback periods ranging from two to five years depending on format, location, and execution quality. This article walks through the calculation framework, compares return potential across system types, and identifies the variables that accelerate — or delay — your break-even point.
For operating margins and revenue-per-wash benchmarks, see our car wash profit margin benchmarks guide. This piece focuses on the investment return.
Understanding car wash ROI: what it really measures
Car wash ROI measures the return on your capital investment — the equipment, site preparation, permitting, and working capital you put in before washing a single vehicle. It answers a different question than profit margin. ROI and payback period tell you when you recoup the money you spent to build the site. Profit margin tells you what percentage of each wash you keep after operating costs. Both matter, but they serve different stages of the decision.
The formula is straightforward:
ROI = (Annual Net Profit / Total Investment) x 100
A good ROI for a car wash typically lands in the 20–35% annual range. That makes automatic car washes competitive with many franchise models and significantly stronger than passive real estate investments — net-leased car wash properties currently track at approximately 6.3% cap rates, which tells you institutional investors see the asset class as stable and attractive.
But ROI is only as reliable as the inputs you feed it. The next step is calculating the number that matters most: your payback period.
How to calculate your car wash payback period
Payback period strips the percentage abstraction away and gives you a timeline. It answers the most practical question in any equipment investment: how many months of operation until cumulative net cash flow equals what you spent?
Payback Period = Total Investment / Annual Net Cash Flow
What counts as total investment
Your total investment is every dollar spent before the first wash cycle runs. For most automatic car wash projects, that includes:
Equipment purchase — the wash system itself, including conveyors, brushes, arches, dryers, and chemical delivery
Freight and installation — shipping, rigging, and commissioning
Site preparation — concrete work, drainage, utility connections, bay construction or tunnel structure
Permitting and licensing — local building permits, environmental compliance, business licensing
Signage and branding — exterior signage, menu boards, digital displays
Initial working capital — chemical inventory, spare parts stock, first few months of operating cash
For a detailed breakdown of equipment and build-out costs by system type, see our automatic car wash system cost breakdown.
What counts as annual net cash flow
Annual net cash flow is gross wash revenue minus all recurring operating costs: labor, chemicals, water, electricity, maintenance, insurance, and your lease or mortgage payment. This is the cash your operation generates after keeping the doors open — the money available to pay back your initial investment.
Worked example: express exterior tunnel
Here's what the math looks like for a realistic express tunnel scenario:
Input | Amount |
|---|---|
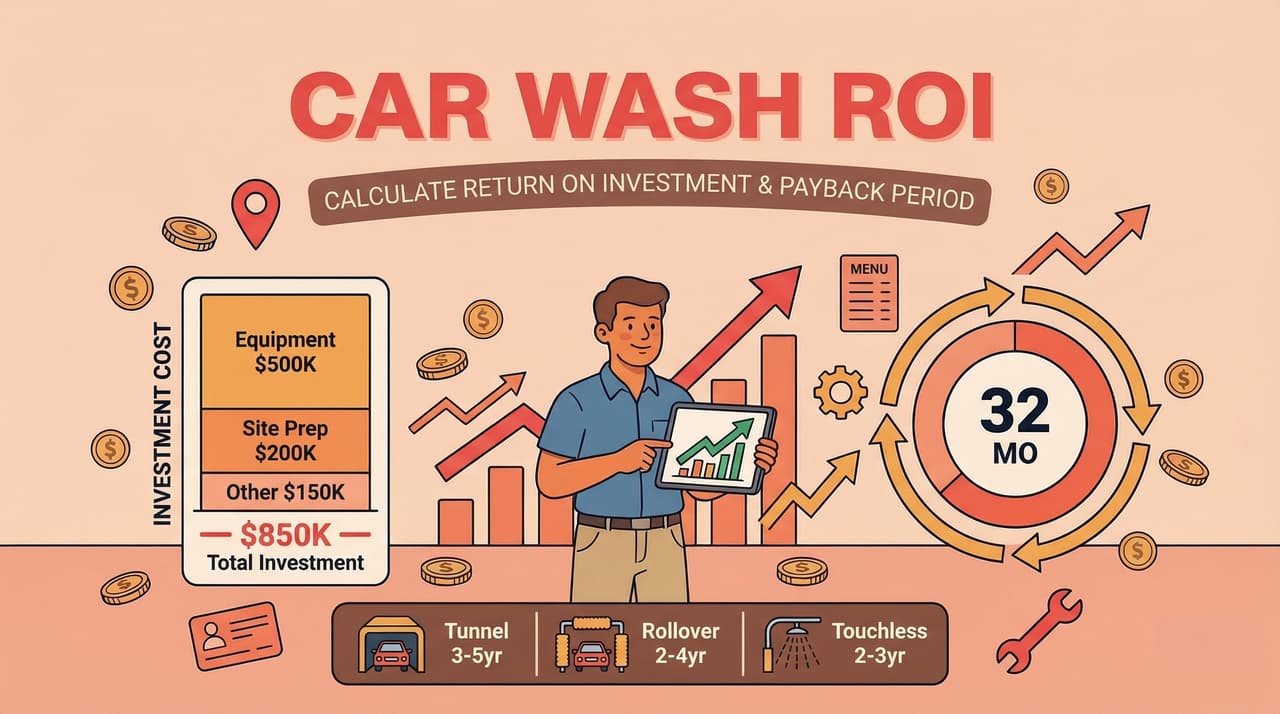
Total investment | $850,000 |
Equipment (tunnel system) | $500,000 |
Site preparation | $200,000 |
Permitting, signage, working capital | $150,000 |
Annual revenue | $600,000 |
Washes per day (average) | 150 |
Average ticket price | $11.00 |
Operating days per year | 365 |
Annual operating costs | $290,000 |
Labor, chemicals, water, power, maintenance, insurance, lease | Combined |
Annual net cash flow | $310,000 |
Payback period | ~2.7 years (32 months) |
This aligns with standard express car wash financial models that project approximately 32-month payback periods for well-positioned sites. Your actual numbers will shift based on location, ticket price, and operating costs — but the framework stays the same.
The car wash break even point is where cumulative net cash flow crosses your total investment line. In this example, that happens around month 32. Every month after that, the $310,000 annual net cash flow is return on your investment.
Car wash ROI by system type: tunnel, rollover, and touchless compared
Not all systems generate the same return profile. The investment amount, throughput capacity, and revenue ceiling vary significantly — and those differences shape your payback timeline.
Car wash ROI by system type
Metric | Tunnel | Rollover / Gantry | Touchless |
|---|---|---|---|
Typical investment range | $500K–$4M+ | $200K–$500K | $150K–$350K |
Throughput capacity | 50–60+ vehicles/hour | 10–15 vehicles/hour | 8–12 vehicles/hour |
Estimated annual revenue | $400K–$1.2M+ | $150K–$400K | $100K–$300K |
Typical payback period | 3–5 years (express: 2.5–3.5) | 2–4 years | 2–3 years |
Revenue ceiling | Highest | Moderate | Lower |
Tunnel systems carry the highest upfront investment but offer the highest throughput and revenue ceiling. An express exterior tunnel processing 50–60 vehicles per hour generates volume that rollover and touchless formats simply cannot match. The TX-380 tunnel system, for example, is engineered for exactly that throughput range — and real-world deployments confirm it. Splash N Go sites in Japan regularly achieve 500+ washes per day during peak periods, demonstrating the revenue ceiling that high-throughput tunnel operations can reach.
Rollover and gantry systems require moderate capital and deliver solid returns for sites where traffic volume doesn't justify a tunnel. Lower operating costs partially offset the lower throughput. Payback in the 2–4 year range is realistic for well-located rollover sites processing 40–80 vehicles per day.
Touchless systems have the lowest capital requirement and can achieve the fastest absolute payback — but the lower revenue ceiling means long-term total return is more modest. They work well for markets with high demand for contact-free washing, particularly where premium vehicle owners are the primary audience.
The critical insight: automatic car wash investment return depends more on throughput multiplied by average ticket than on equipment cost alone. A $500,000 tunnel processing 50 vehicles per hour has a fundamentally different ROI profile than a $200,000 rollover processing 12. For a deeper comparison of which format fits your site, see our tunnel vs in-bay comparison.
Multiple SKU configurations — like those available for the TX-380 series — let you right-size capex to your volume targets and power availability, so you're not overpaying for capacity you won't use in year one.
Five variables that accelerate or delay your payback
System type sets the baseline, but five operational variables determine whether you hit the short end or the long end of your payback range.
1. Location and traffic count. This is the single biggest variable. A site on a high-traffic corridor with 30,000+ vehicles per day offers fundamentally different revenue potential than a secondary road with 8,000. No equipment decision overcomes a weak location. Do your traffic study before your equipment study.
2. Membership and subscription mix. Recurring revenue changes the payback math. Instead of depending entirely on drive-by traffic and weather, a strong membership program delivers predictable monthly cash flow. Industry data shows membership revenue grew approximately 10% year over year in 2025, with churn stabilizing at 7–8%. A site with 40%+ of revenue from memberships has far more predictable cash flow — and shorter effective payback — than a purely transactional operation.
3. Equipment efficiency. Chemical consumption, water usage, and energy draw directly shape your cost-per-wash. Lower cost-per-wash means higher net cash flow per vehicle, which compounds into faster payback across thousands of washes each month. Precision matters here: CNC metering pumps with 0.28 mL dosing accuracy extend chemical drum life to approximately 3,000 washes per 20 kg drum — a measurable reduction in chemical cost that adds up across a year of high-volume operation.
4. Service menu depth. Upsell packages — ceramic coating, tire shine, underbody flush — increase your per-vehicle ticket without proportional increases in labor or time. If your base wash averages $10 and a premium package averages $18, converting even 25% of volume to the premium tier materially accelerates payback.
5. Uptime and maintenance discipline. Unplanned downtime during peak hours directly destroys throughput and delays payback. Every hour offline during a Saturday afternoon rush is revenue you never recover. Preventive maintenance programs, modular equipment designs that allow individual component service without full-line shutdown, and reliable parts availability are the operational insurance your ROI projection depends on.
Is a car wash a good investment in 2026?
For operators who right-size their equipment to their market and execute with discipline — yes. The fundamentals support it.
The global car wash market is projected to grow from $28 billion in 2025 to $43.6 billion by 2031, advancing at a 7.5% compound annual growth rate. The U.S. market alone represents approximately $20.7 billion in annual revenue. Institutional capital continues to flow into the sector, with net-leased car wash properties tracking at roughly 6.3% cap rates — a signal that sophisticated investors view car wash real estate as stable and income-producing.
The maturation of subscription and membership models has reduced one of the biggest historical risks in car wash investing: revenue volatility. A strong membership base provides recurring cash flow that smooths seasonal dips and weather impacts, making payback timelines more predictable.
That said, competition is intensifying. The ICA's industry pulse points toward modest single-digit growth, with success increasingly tied to efficiency, differentiation, and disciplined investment. Location selection, equipment right-sizing, and operational execution matter more than ever. A well-positioned site with the right equipment and a strong membership program can realistically target 20–35% annual car wash ROI. A poorly positioned site with mismatched equipment will struggle regardless of market tailwinds.
Key takeaways
Car wash ROI typically ranges 20–35% annually, with payback periods of 2–5 years depending on system type, location, and operational execution.
Use the payback formula with your specific inputs — Total Investment / Annual Net Cash Flow — rather than relying on industry averages alone. Your location, traffic count, and ticket price drive the calculation.
System type determines your revenue ceiling. Tunnels offer the highest throughput and long-term return potential. Rollover and touchless systems offer faster absolute payback at lower scale.
Three operational levers accelerate payback most directly: membership mix (recurring revenue), equipment efficiency (lower cost-per-wash), and maintenance discipline (protecting uptime).
Right-size the system to your site. Overinvesting extends payback through excess debt service. Underinvesting caps your revenue ceiling. The goal is matching equipment capacity to realistic throughput projections.
Ready to model your car wash ROI?
Every site has its own traffic patterns, competitive landscape, and revenue potential. Our engineering team can help you right-size the system to your throughput targets and budget — so your payback period calculation starts from a realistic foundation, not a guess.
Related articles
Explore more insights from the HyTian team.
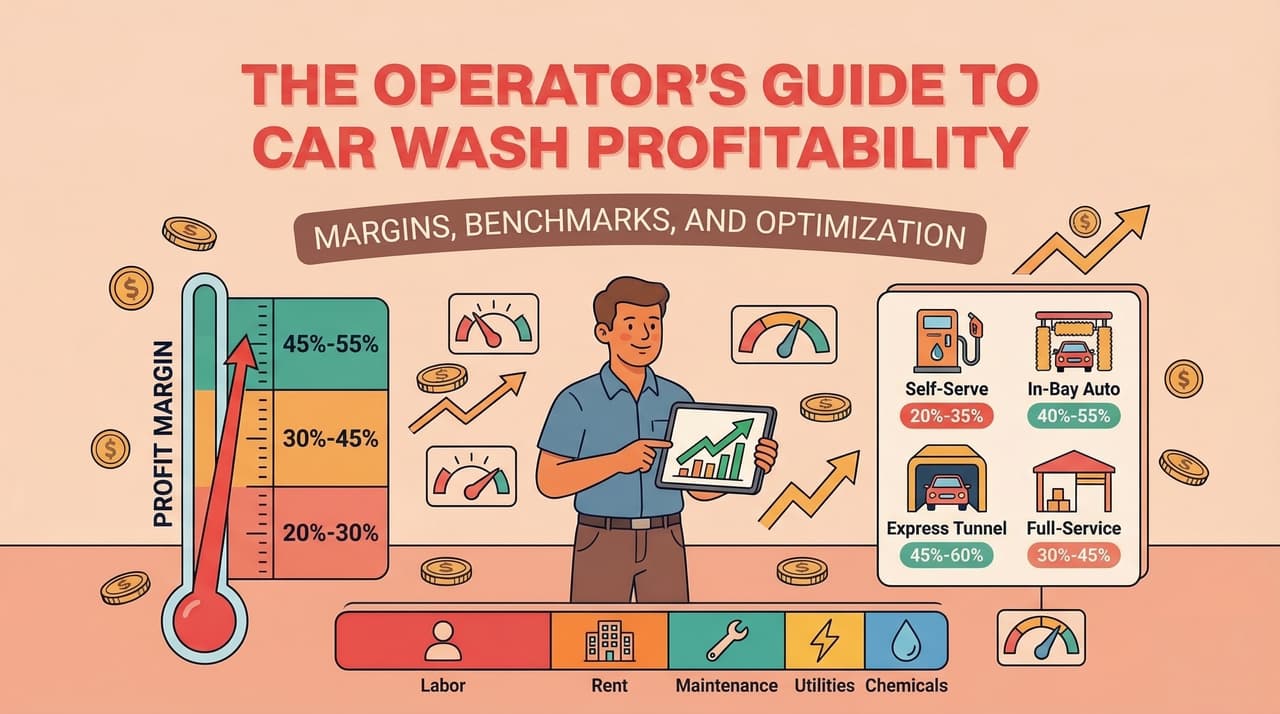
The Operator's Guide to Car Wash Profitability: Margins, Benchmarks, and Optimization
Car wash profit margins range 20–55% by business model. See realistic benchmarks, operating cost breakdowns, and five optimization levers operators control.

How Much Does a Car Wash Make? Revenue Benchmarks by Business Model
How much does a car wash make? Revenue ranges from $41K to $2M+ depending on business model. See benchmarks for self-serve, IBA, tunnel, and express operations.

How Much Does an Automatic Car Wash System Cost? A Complete Investment Breakdown
Automatic car wash system costs range from $15,000 to $350,000+ for equipment alone. Here's what drives the price, what the total investment looks like, and how to compare quotes.